

Data Visualization Solution to Visualize the Number of Forbes Leading Privately Owned Companies in United States by Using Tableau
Executive Summary
Ray Business Technologies’ subject matter experts worked closely with stakeholders andunderstood the business needs of the application. RBT team designed the modules with
high usability and to the satisfaction of the end users. This increased the business margins.
Objective
To visualize the number of Forbes leading privately owned companies in United States. Data is taken from Forbes website to know which is the leading privately owned - companies in US
Data consists of following fields
❖ Company
❖ Industry
❖ Ranking
❖ State
❖ Annual Revenue
❖ Company Count
❖ Employees
❖ Number of Records
❖ Revenue in $
❖ State Coun
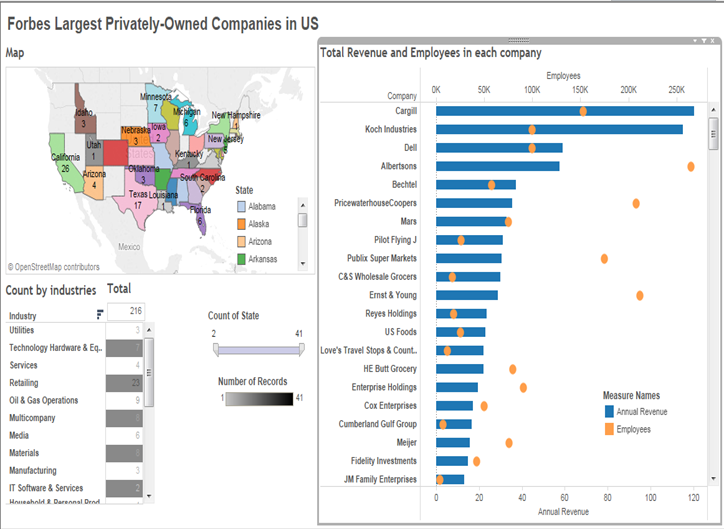
Following is the Tableau dashboard for Forbes data
.png "1-(1).png")
The following screenshot explains Geographical representation of each state and number of companies, employees and revenue in each state

2. Number of companies in each industry -
Following table shows number. of companies in each industry

3.Total revenue and employees in each company -
This bar chart shows total revenue and employees in each company

4. Average revenue of each company

Benefits / Business Case
Tableau and its benefitsTableau is very interactive and easy for deployment for your organization. With the use of Tableau, you can get effectively capitalize on the given data. The innovative and extensive features of Tableau makes it more popular and it is extensively used globally. Let us discuss its capabilities and benefits which include the following.
- With one click you can view analytical map that is created with excellent geographic visibility
- It helps your business insights that are multi-dimensional
- It provides Analytics related to Web-based in minutes.
- For all internal and external meetings, you can create a compelling presentations
- Through web deployment, Sharing and Collaborating is much possible
- Low total cost of ownership, Low maintenance, easy deployment and most importantly easily plugs into your present or existing IT infrastructure.
We use cookies to provide the best possible browsing experience to you. By continuing to use our website, you agree to our Cookie Policy